User Perception of Differences in Recommender Algorithms


TL;DR
- diversity is good
- novelty is bad
- diversity and accuracy correlate positively
- user-user CF is bad
- item-item and SVD are similar
Goal: identify user-perceptible differences between recommenders.
Why?
‘Accuracy is not enough’ [McNee et al. 2006]
What do users want/need?
How do we measure it?
Get data on
- what users want
- how algorithms differ
that can be used to calibrate metrics

Research Questions
- RQ1
- How do subjective properties affect choice of recommendations?
- RQ2
- What differences do users perceive between lists of recommendations produced by different algorithms?
- RQ3
- How do objective metrics relate to subjective perceptions?
Context: MovieLens
- Movie recommendation service & community
- 2500–3000 unique users/month
- Uses LensKit for recommender engine
- Launching new version
- Experiment deployed as intro to beta access
Algorithms
Three well-known algorithms for recommendation:
- User-user CF
- Item-item CF
- Biased matrix factorization (FunkSVD)
- All restricted to 2500 most popular movies
- Full configurations available in Ekstrand's thesis
Each user assigned 2 algorithms
Predictions
Predicted ratings influence list perception.
To control, 3 prediction treatments:
- Standard raw predictions (0.5–5 stars)
- No predictions
- Normalized predictions (3×5, 4×4.5, 3×4)
Each user assigned 1 condition
No effect of predict condition.
Survey Design
Initial ‘which do you like better?’
22 questions
- ‘Which list has more movies that you find appealing?’
- ‘much more A than B’ to ‘much more B than A’
- Target 5 concepts
Forced choice selection for future use
Free-form text field
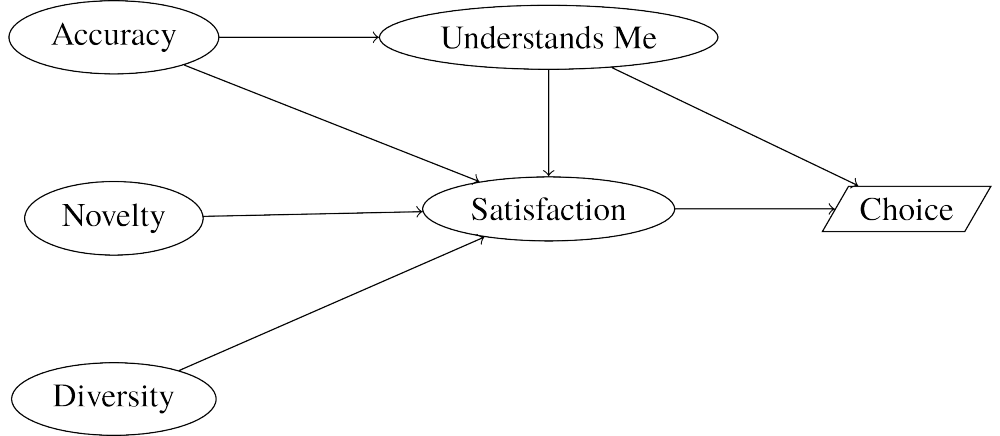
Hypothesized Model
Example Questions
- Diversity
- Which list has a more varied selection of movies?
- Satisfaction
- Which recommender would better help you find movies to watch?
- Novelty
- Which list has more movies you do not expect?
Analysis features
- joint evaluation
- users compare 2 lists
- judgment-making different from separate eval
- enables more subtle distinctions
- hard to interpret
- factor analysis
- 22 questions measure 5 factors
- more robust than single questions
- structural equation model tests relationships
Response Summary
582 users completed
| Condition (A v. B) | N | Pick A | Pick B | % Pick B |
|---|---|---|---|---|
| I-I v. U-U | 201 | 144 | 57 | 28.4% |
| I-I v. SVD | 198 | 101 | 97 | 49.0% |
| SVD v. U-U | 183 | 136 | 47 | 25.7% |
bold is significant (p < 0.001, H0 : b/n = 0.5)
Measurement Model
- Comparative questions — all measures are relative
- Higher values → ‘B more than A’
- Conditions omitted for clarity
Differences from Hypothesis
- No Accuracy, Understands Me
- Edge from Novelty to Diversity
RQ1: Factors of Choice
Choice: Satisfaction
Satisfaction positively affects impression and choice.
Choice: Diversity
Diversity positively influences satisfaction.
- Satisfaction mediates diversity's impact on preference
Choice: Novelty
Novelty hurts satisfaction and choice/preference.
Choice: Novelty (cont.)
Novelty improves diversity (slightly).
- outweighed by negative satisfaction effect
Choice: Novelty (cont.)
Novelty has direct negative impact on first impression.
- Also seems stronger overall, but difficult to assess
Implications
Novelty boosts diversity, but hurts algorithm impression
- In context of choosing an algorithm
Negative impact of novelty diminishes with close scrutiny
- Can recommender get less conservative as users gain experience?
Diversity has positive impact on user satisfaction
Diversity does not trade off with perceived accuracy
RQ2: Algorithm Differences
- Pairwise comparisons very difficult to interpret
- Method: re-interpret as 3 between-sujects pseudo-experiments:
| Baseline | Tested | % Tested > Baseline |
|---|---|---|
| Item-Item | SVD | 48.99 |
| User-User | 28.36 | |
| SVD | Item-Item | 51.01 |
| User-User | 25.68 | |
| User-User | Item-Item | 71.64 |
| SVD | 74.32 |
RQ2 Summary
- User-user more novel than either SVD or item-item
- User-user more diverse than SVD
- Item-item slightly more diverse than SVD (but diversity didn't affect satisfaction)
- User-user's excessive novelty decreases for experienced (many ratings) users
- Users choose SVD and item-item in roughly equal measure
- Results consistent with raw responses
RQ3: Objective Properties
Measure objective features of lists:
- Novelty
- obscurity (popularity rank)
- Diversity
intra-list similarity (Ziegler)
- Sim. metric: cosine over tag genome (Vig)
- Also tried rating vectors, latent feature vectors
- Accuracy/Sat
- RMSE over last 5 ratings
Relativize: take log ratio of two lists' values
Property Distributions
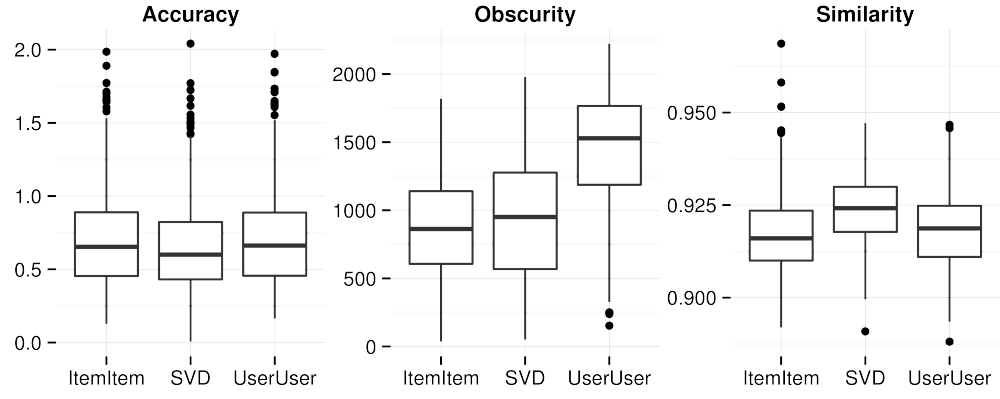
- Obscurity & similarity metrics consistent with RQ2 results
Model with Objectives
- Each metric predicts feature
- Metric effect entirely mediated
- Conditions still relevant (not all signal is captured in metric)
Summary
Novelty has complex, largely negative effect
- Exact use case likely matters
- Complements McNee's notion of trust-building
Diversity is important, mildly influenced by novelty.
- Tag genome measures perceptible diversity best, but advantage is small.
User-user loses (likely due to obscure recommendations), but users are split on item-item vs. SVD
Consistent responses, reanalysis, and objective metrics
Refining Expectations
Commonly-held offline beliefs:
- Novelty is good
- Diversity and accuracy trade off
Perceptual results (here and elsewhere):
- Novelty is complex
- Diversity and accuracy both achievable
Outstanding Questions
- Are II/SVD interchangeable?
Do user characteristics predict algorithm performance?
- very small effect of experience
- need to study more
- Can user-user be fixed w/ hybridization?
Do users' stated choices predict long-term preference?
- Follow-up experiment design in progress
Questions?
This work funded by NSF grants IIS 08-08692 and 10-17697.